Ayan Arora is a young intern at Raahgiri Foundation, Gurugram
This article tries to understand the issue of vehicular air pollution through a literature review and a survey in Delhi. It has also tried to evaluate the motility trends of the sample urban population, the reasons behind the particular choices, and personal opinions on improving public transport infrastructure.
INTRODUCTION
WHO estimates that nine out of ten people breathe air that contains high levels of pollutants. In 2017, nearly 15% of population deaths in low-income countries like South and East Asia were attributed to air pollution, while higher-income countries experienced only about 2%.
Vehicle pollution is the pollution produced by any transport vehicle. The combustion engines of vehicles are responsible for the emission of different types of gases and particles that pollute the environment. A NASA study from 2010 showed that automobiles were the world’s largest net contributor to climate change pollution.
The Environment Protection Agency (EPA) annual report estimates the total national greenhouse gas emissions associated with human activities across the United States, the largest source being burning fossil fuels for electricity, heat, and transportation. According to this report (2020), emissions from transportation account for about 27 percent of total U.S. greenhouse gas emissions, primarily from fossil fuel combustion for cars, trucks, ships, trains, and planes.
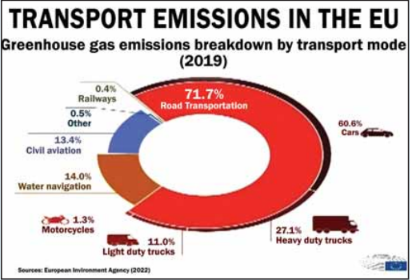
Similarly, in The European Union (EU), transport was responsible for about a quarter of the EU’s total CO2 emissions in 2019, of which 71.7% came from road transportation, according to a report from the European Environment Agency.
How Do Vehicles Cause Pollution
Air pollution from cars, trucks, and buses is split into primary and secondary pollution. Primary pollution is emitted directly into the atmosphere whereas secondary pollution results from chemical reactions between pollutants in the atmosphere.
The major pollutants from cars and other vehicles are:
- Particulate matter (PM): Also called particle pollution, this a mixture of solid particles and liquid droplets found in the air that contribute to atmospheric haze and can damage your lungs and enter the bloodstream. PM can be a primary pollutant (emitted directly from a source) or a secondary pollutant from reactions of hydrocarbons, nitrogen oxides, and sulfur dioxides. Diesel exhaust is a main source of particulate matter from automobiles. Particle pollution includes:
l PM10: inhalable particles, with diameters that are generally 10 micrometers and smaller.
l PM2.5: fine inhalable particles, with diameters that are generally 2.5 micrometres and smaller.
- Carbon monoxide (CO): is released when fuels are burnt. High concentrations affect the heart and brain. According to the Environment Protection Agency, as much as 95% of all city CO emissions may come from motor vehicle exhaust.
- Nitrogen dioxide (NO2): when fuel burns, nitrogen and oxygen combine to form oxides of nitrogen (NOx). These oxides can cause severe respiratory problems. These also form secondary particulate matter.
- Greenhouse gases (GHGs): Emissions from tailpipes of cars using fossil fuels increase the levels of carbon dioxide and other greenhouse gases in the atmosphere. Greenhouse gases lead to global warming by forming a blanket around Earth and trapping energy in the atmosphere.
- Volatile organic compounds (VOC): These hydrocarbons and NOx combine in sunlight to produce ozone, contributing to smog and causing respiratory problems and even different types of cancer.
- Sulphur dioxide (SO2): Power plants and vehicles create this pollutant by burning sulfur-containing fuels, especially diesel, and coal. Sulfur dioxide can react in the atmosphere to form fine particles and pose a health risk.
- Emissions from tires and brakes: These emissions can also cause health problems and contribute to climate change.
- Smog Forming Emissions: these include nitrogen oxide, non-methane organic gases, carbon monoxide, particulate matter, and formaldehyde. These get trapped close to the ground and can form a brownish haze that pollutes the air, making it difficult for some people to breathe, triggering lung diseases such as asthma, emphysema, and bronchitis.
Harmful effects of pollution
People experience a wide range of health effects from being exposed to air pollution. Effects can be broken down into short-term effects and long-term effects.
Short-term effects, which are temporary, include illnesses such as pneumonia or bronchitis, and irritation to the nose, throat, eyes, or skin. Air pollution can also cause headaches, dizziness, and nausea.
The long-term effects of air pollution can last for years or for an entire lifetime. They can even lead to a person’s death. Long-term health effects from air pollution include heart disease, lung cancer, respiratory diseases, and nerve, kidney, liver, and brain damage. Some scientists suspect that air pollutants can cause even birth defects.
Increase in the number of cars in recent years
As the number of vehicles is expected to double to two and a half times over the next 30 years, congestion will significantly worsen the quality of ambient air.
Carbon dioxide emissions from passenger cars worldwide from 2000 to 2020 (in billion metric tons)
Passenger cars produced 3 billion metric tons of CO2 emissions worldwide in 2020. The emissions produced by passenger cars have been steadily rising over the past two decades, increasing from 2.2 billion metric tons in 2000 to a peak of 3.2 million metric tons according to a survey called ‘Global CO2 emissions in transport by mode in the Sustainable Development Scenario’ by IEA (International Energy Agency).
Below are some statistics regarding pollution caused by fossil fuels:
The amount of tailpipe carbon dioxide (CO2) created from burning one gallon of fuel:
l CO2 Emissions from a gallon of gasoline: 8,887 grams CO2/ gallon
l CO2 Emissions from a gallon of diesel: 10,180 grams CO2/ gallon
l Diesel creates about 15% more CO2 per gallon. However, many vehicles that use diesel fuel achieve higher fuel economy than similar vehicles that use gasoline, which generally offsets the higher carbon content of diesel fuel.
Average annual carbon dioxide (CO2) emissions of a typical passenger vehicle :
l A typical passenger vehicle emitted about 4.6 metric tons of carbon dioxide per year, assuming a fuel economy of about 22.0 miles per gallon and distance of around 11,500 miles per year. Every gallon of gasoline burnt created about 8,887 grams of CO2.
Tailpipe carbon dioxide (CO2) emitted from driving one mile:
l The average passenger vehicle emits about 404 grams of CO2 per mile. This number can vary based on two factors: the fuel economy of the vehicle and the amount of carbon in the vehicle’s fuel.
Comparison of CO2 emissions by a car used by one-person vs that from a bus carrying more people:
Sayed K., Augusta, Maine, United States in 2022 gave a rough estimate of emissions from a car vs those from a bus. (15)
 In Table 1, it is seen that on average he travelled 20 miles per day. Assuming being active 365 days a year with the same average mileage, he would emit 2.5405 tons of CO2/ year and have a social cost of $127.02. Then he compared his travel using a public bus or a bus provided by a company. In the 2nd table, it can be seen that the emission by bus is less. It does not mean that a bus emits less CO2 but since it is used by more people, average CO2 per person is less than the car. In this case, his annual CO2 tonnage was 0.002 tons and social cost was $36.5. Both the tonnage and social cost are lower in comparison to using the car. From the above comparison, it was evident that buses were more environmentally friendly.
Similarly, The Centre on Globalization, Governance & Competitiveness (CGGC) paper, said that using transit buses is more energy efficient and “green” compared to auto usage. A typical passenger car carrying one person gets 25 passenger miles per gallon, while a conventional bus at its capacity of 70 (seated and standing) gets 163 passenger miles per gallon. A passenger car carrying one person emits 89 pounds of CO2 per 100 passenger miles, while a full bus emits only 14 pounds.
Some insightful statistics about the use of buses and trains instead of personal vehicles is available (16):
l A bus with as few as seven passengers is more fuel efficient than a car carrying one person.
l A fully occupied train is on average fifteen times more fuel efficient than a car.
l Buses produce just 20% as much carbon monoxide per passenger mile as single occupant cars.
l They also produce much less hydrocarbons (ozone precursors), nitrogen oxides, and other pollutants.
Hence, the available data shows that choosing public transport over own, reduces global greenhouse gas emissions and individual carbon footprints.
Air Pollution in India and Delhi
Air pollution in India is estimated to kill about 2 million people every year; it is the fifth largest killer in India. India has the world’s highest death rate from chronic respiratory diseases and asthma, according to the WHO. In Delhi, poor-quality air irreversibly damages the lungs of 2.2 million or 50 percent of all children.
India’s Ministry of Earth Sciences published a research paper in October 2018 attributing almost 41% of air pollution to vehicular emissions, 21.5% to dust and 18% to industries.
According to a WHO survey of 1,650 world cities, and a survey of 7,000 world cities by the US-based Health Effects Institute in August 2022, air quality in Delhi was the worst of any major city in the world.
A 2018 study by Automotive Research Association of India and The Energy and Resources Institute estimated that motor vehicles are the primary source of pollutants within Delhi and contribute to about 40 percent of PM 2.5 emissions. A new analysis from Centre for Science and Environment (CSE) showed that vehicles have emerged as the biggest contributor to particulate pollution in Delhi – their real time share has increased to more than 50 per cent during the early phase of winter.
Review of previous studies and surveys clearly emphasizes that air pollution is one of the major killers globally and is directly related to traffic congestion and a number of vehicles plying on the road.
Methodology
Fossil-fuel motor vehicles are considered one of the largest contributors to air pollution and greenhouse gas emissions and, consequently, to global warming. According to ‘Our World in Data’, air pollution contributes to approximately 4.5 million premature deaths in the world every year (7.8% of global deaths). The deadly combination of outdoor pollution and toxic emissions from the combustion of fossil fuel is one of the leading causes of chronic and terminal health issues as well as declining cognitive function.
This paper evaluates the present transport trends, especially in Delhi, the rationale behind these trends, and the popularity of green transport (walking or cycling) among the sample population. The study also took public opinion on what could be done to advance public transport and walking/ cycling. The outcome of the survey measured the awareness and the perception of the public related to this subject. Finally, an attempt was made to present an exhaustive list on the basis of the answers of the respondents and the plethora of data available from previous research and policies, of concrete steps that can be taken to improve public transport and to encourage walking and cycling.
A survey designed for this article had a sample size of 305 responses. The survey tried to evaluate the motility trends of the sample urban population, the reasons behind the particular choices, and personal opinions on improving public transport infrastructure. As a result, it gauged public awareness of this issue. It also questioned the reluctance of Indians (major sample size) to cycle/walk to work or for leisure, shopping, etc.
The data collected was through the means of a Google survey form. The form was circulated using the social media messaging application, WhatsApp, email, or manually. The form had well-defined, close-ended, and concise questions. The answer key was in the form of multiple-choice questions. An attempt was made to keep the answer list exhaustive and mutually exclusive.
The results were analysed either through Google Forms or Microsoft Excel. The results hence interpreted were discussed and comparisons were drawn with existing statistics and data available.
Observations And Discussions
In the sections below we present and discuss the various findings based on the themes covered in the survey.
All the findings were discussed, analyzed, compared, and contrasted with existing literature.
An attempt was made to ascertain the interrelation between the affluence and social status of a person (as judged by their profession) and their transport preferences and between the city they inhabited and its limitations regarding public transport infrastructure.
- Cities Covered in The Survey:
 The analyses of the data in spreadsheets revealed the major cities which the participants inhabited.
Since the bulk of the respondents in the sample population were from Delhi NCR (69.8%) in India, a constant parallel has been drawn between the data collected in this survey and the previously existing data about Delhi from various sources. In other words, Delhi has been used as a prototype for all the findings in this survey.
- Percentage of Sample Using Public Transport:
In the survey conducted, 77.4% of the respondents used one or the other form of public transport whereas 22.6% did not avail the mass transit services in their city.
This data corroborates Delhi Government’s Socio-Economic Survey, conducted between November 2018 and November 2019, that revealed heavy reliance of Delhi population on public transport. The report showed that 69.80 % of the people in Delhi use buses, charter buses, metro and public transport to go to work. Private cars were used by only 0.32 % of the people. 15.44 % of the people in the capital used private two-wheelers to go to work. The rest used cabs, taxis, e-rickshaws, etc.
III. Type of Public Transport Service Availed:
 When asked what kind of public transport was used mainly in their daily transit, the respondents indicated their choices. Bus, metro-train, cabs and three wheelers dominated the choice of public transport used by the participants, most resorting to more than one of these to complete their daily journeys. These findings mainly reflect the situation in Delhi, as indicated by The Socio-Economic Survey report that showed that 11.15 per cent of the people in the capital use cabs, e-rickshaws, or taxis whereas buses and metro contributed the lion’s share by scoring 69.8%.
- How often was public transport used on a monthly basis:
While 32.8% participants said that they used public transport very infrequently, 24.2% used it for 0-3 days in a month, 12.3% for 4-7 days, 30.7% used it for a week or more (majority using it for more than 15 days in a month).
It is perceived that 70% of the public transport users still do not use it on a daily basis or claim to use it very infrequently or for a couple of days in a month. Since urban public transport is usually more developed, the reasons behind this trend needed to be ascertained and were probed in further sections of the survey.
- Ownership of car or another private vehicle:
Question pertaining to owning or having access to a private vehicle showed that 79.1% of the respondents own or have access to a private vehicle. Only 20.1% of the sample did not own a private vehicle.
 Since the data was mainly collected online from people who had smartphones and were professionals, mainly doctors, engineers, teachers etc., I hypothesized that the affluent section of the society has disposable income to own and run their own vehicle and ergo the convenience and freedom of using one’s own car outweighs the use of public transport. This holds true especially in a city like Delhi where urban land planning has led to city limits stretching in all directions, increasing the mean travel time of travelling.
Much previous research has considered car ownership as an indicator of affluence or social standing due to the costs associated with purchase and maintenance. So, cars are not just bought to fulfil mobility needs but to exemplify one’s socio-economic status in today’s market driven settings.
- Walking or cycling to work as a viable option:
The participants were further asked if they walked or cycled to work. Only 15.2% walked or rode the bike daily, 25% said that they resort to the above mode only sometimes whereas the vast majority (59.8%) never walked/cycled to work.
However, considering that Delhi NCR is the main prototype for my data sample and rest of the sample population too is from Indian Metropolitan and tier 2 cities one can easily see that this survey result does not match with the data available on most government sites.
According to the findings released in a day-long international consultation on ‘Our right of way: walk and cycle’, organised by Centre for Science and Environment (CSE), in 2011, it was revealed that one third of Delhi’s population walks to work.
The Council on Energy, Environment and Water (CEEW) during a primary survey of urban Indians in October 2022 found that 63% walked for their needs and 6% used cycles even if they used their private vehicles alongside as means of transport.
Then what is the reason behind the discrepancy between my findings (with 60% respondents saying that they never walk or cycle to work) and those published previously by various agencies.
I postulated that my sample population was representative of the section of society that is affluent and has to travel long distances for work as most belong to big cities like Delhi NCR, Mumbai, Bangalore etc. The small section of people who worked as maids, sweepers, household help, etc. all used cycles or walked to work. Low-income households whose members rely on walking as their main mode of transportation are located close to their places of work. These are often in the form of informal residential settlements requiring short commutes
VII. Preference to use own private vehicle over public transport:
This section presents the stance towards modal choice behaviour between public transport and private cars. 62.1% participants favoured private transport over mass transit, 26.3% said that they would incline towards public transport despite having access to a car. 12.5% said this question was not applicable to them (assumption is that they did not possess a private vehicle, hence could not comment). This clearly reveals that public transport is often perceived to be a poor alternative to car use.
VIII. Reasons behind choosing to drive the car for travel purposes rather than use public transport:
Maximum responses for preferring cars to public transport mirrored the problems inherent to a big sprawling highly populated city like Delhi.
Lack of public transport in the area of residence: In most urban areas across the country, the development of public transport has not been able to meet the rapid rise of urban population.
Too many transfers and hence long commute: Due to the sprawling nature of the metropolitan cities and lack of last mile connectivity of the available transport system travel from one place to another requires many changes of transport modalities in between. So, the first and foremost requirement is that public transport encompassing multiple modes of transport should be seamless. It should feel like a single journey, there should not be a break in any leg of the system. But in India, we do not have that seamless public transport as each mode of transport is operated by a different organization.
Safety issues: should be gender neutral but have a more profound meaning for women and elderly individuals.
Lack of cleanliness: Spitting and littering, insects and pests, and danger of germ transmission is rampant in and around public transport facilities.
- Preference to use public transport over private vehicle:
Respondents indicated their preference for public transport by choosing one or more of the following aspects:
- Too much traffic on the road:
 Approximately 43% of the respondents said that they did not prefer their car over public transport despite owning one, due to too much traffic on the road.
Traffic congestion is one of the most visible, pervasive, and immediate transport problems plaguing not only India but also most of the cities of the world on a daily basis. According to a report made by IBM’s Global Commuter Pain Study in 2013, New Delhi is among the top 10 cities in the world having the worst traffic jams due to increasing population, increasing cars, mixed traffic curb parking, etc.
Traffic congestion results in unnecessary delays and reduction in speed, an increase in the number of accidents on the roads, and an increase in air pollution and greenhouse gas emissions.
- Lack of Parking: The participants indicated that lack of parking is one of the major factors in forcing them to resort to public transport. The
 parking problem in cities and urban areas is due to a gap between parking demand (number of cars in need of parking spaces) and parking supply (number of parking spaces sufficient for cars that need to be parked). This gap may be due exponential increase in number of cars plying on city roads, violation of building codes and zoning regulations, and no consideration for parking structures with several floors.
 - Very Long Commute: Approximately 18% of the participants cited the commute from one destination to another as very long and thus reason for not opting for car use. Most public policies in India actually encourage rampant sprawled development. This generates long trips and hence reluctance to use personal transport.
- Too expensive to own, maintain or run a private vehicle: Despite a rise in mean family incomes and lower rate of loan interests, it is expensive for the lower- and middle-income group families to buy a car. Maintenance and repairs, high insurance premiums and high prices of gasoline and diesel a deterrent to run one’s own vehicle on a daily basis.
- Promoting public transport in the city:
The participants of the survey gave their input towards measures that can be adopted to encourage public transport in their city.
From the adjacent graph, it can be easily visualized that the respondents feel that public transport can be made more user-friendly and can gain popularity amongst the public by improving several aspects
The journey experience in public transport can be split into a number of distinct stages.
Access time: time required to access the first stop or station where the vehicle is boarding, from the trip origin.
Waiting time: at a bus stop or station platform before boarding a public transport vehicle is an important factor. Waiting time can increase or be erratic when operating frequency of buses, trains, metro, etc. is not good resulting in overcrowding at bus stops and stations or when the transport provider is not punctual and has random arrivals or when the bus or train timetables and arrival schedules are not displayed prominently. Waiting is inconvenient as it results in discomfort, loss of time and uncertainty in trip arrival time.
In-vehicle time: is the time spent aboard a vehicle while travelling towards a destination. The time spent in the bus or metro can be crucial for the choice a person makes regarding use of public transport for daily travel. The condition of the vehicle, its cleanliness, its comfort levels (air conditioning, condition of seats, etc), whether it has too many unnecessary stops enroute, whether it follows a long circuitous route instead of a direct one and whether it is safe for women, elderlies and the disabled play a decisive role in choosing public transport. In short, in- vehicle time should be comfortable and agreeable and safe.
Transfers: when using more than one public transport vehicle to perform a trip, a transfer is required, which apart from involving walking and waiting time, is a source of inconvenience by itself due to the disruption of the trip as perceived by the user. Too many transfers result in additional wait time, long commute, and pure inconvenience of disrupting the continuity of a trip, often called as the transfer penalty. As stated earlier, public transport encompassing multiple modes of transport should be seamless. Ideally, the entire system of public transportation in a city should come under a unified authority, which can optimize all the resources to provide the best possible service to its citizens (example New York and Singapore). In India, we do not have that seamless system of public transport as each mode of transport is operated by a different organization.
Egress time: time from the alighting of a vehicle at the final stop or station to the actual destination of the trip. This again is directly related to the overcrowding in the buses which in turn depends on low operating frequencies of buses, increasing population, etc. Also, walking distance from the stop to the final destination is also a determinant.
Measures To Encourage Public Transport in The Urban Spaces:
- Improving and upgrading any or all stages of the journey time components mentioned above including frequency, access, etc.
- Adopting Mixed Land Use: Sustainable urban transportation system, requires, integration of land use and transport planning. The Transit Oriented Development (TOD) is a roadmap to integrating public transport systems with the built environment. TOD is the instrument that encourages public transport use through land use planning. It involves the planning of new land development and the management of existing land in such a way as to:
- Improve conditions for the efficient operation of public transport,
- Improve the accessibility of urban areas and enable people to travel more by alternative modes; and
- Increase the demand for public transport, particularly by encouraging mode change from the private car.
- What can be done to encourage walking/ cycling to work for short distances:
The respondents actively gave their view about what measures can be taken to promote the habit of walking or cycling for short distances.
82% of the participants felt that providing safe pavements for pedestrians would encourage pedestrian traffic and embolden more people to take up walking for short distances.
Approximately 68% wanted dedicated cycle paths to promote cycling. Similarly, around 48% opined that providing theft free parking was also instrumental in promoting cycling. 56% were of the opinion that people will take up cycling and walking on a regular basis if traffic was regulated and preference was given to cycles and pedestrians at intersections. That policy makers should prioritise these two non-motorised motility modes in future planning of the city was also thought of as an important step towards promoting cycling and walking by 36% of the participants.
The ever-expanding cities, longer trip distances coupled with inadequate public transit systems and a rapid pace of motorisation are hampering pedestrian and cycling environments in cities. The safety of pedestrians and cyclists is compromised due to this traffic situation.
Much of the road infrastructure in Indian cities is done keeping in mind motorized traffic flow, with emphasis on carriageways designed for fast-moving traffic, grade-separated, signal-free junctions, and elevated roads that are aimed at solving problems posed by vehicular congestion. This type of urban planning has forced the walking and cycling population of the country to the edges of busy roads or worse, struggle with fast-moving motorised traffic making them prone to injury or even death.
Long trips that form a part of the daily commute, less % of roads dedicated exclusively to cycling tracks, lack of dedicated paths, great distance from residences to nearest cycling tracks, lack of proper parking for bicycles in commercial and office premises, and less than ambient temperature for most of the year (extremely high temperature is one of the predominant environmental parameters that discourages people to cycle) are few of the reasons due to which Indians do not prefer to cycle. While Indian cities cannot ape European cities like Amsterdam and Copenhagen in all aspects, a few giant strides in the right direction can drastically alter the face of active transport in India.
Measures to Encourage Active Transport in The Urban Spaces:
- Developing safe continuous, direct routes for cycling in towns and cities, physically separated from pedestrians and motor traffic, limiting conflict between cyclist, pedestrians and motorist.
- Physically segregating bike tracks on roads, including at junctions, is important for promoting cycle use. Minimize overall travel time by considering factors such as detours, number of stops at crossings, traffic lights, and gradients.
- A mere provision of sidewalks for pedestrians doesn’t ensure safety. It must be integrated with safe crossings at intersections or with mid-block crossings, particularly at ingress and egress points of high footfall areas.
- Clear and regular direction signages for both cyclists and motorists. Ensure conflict points at intersections/crossings are clearly presented so that users are aware of the risks and can adapt behaviour appropriately. Visibility of cyclists to motorists should be maximised at the approach to intersections. Cycling facilities should be well lit and well-marked.
- Optimal road surfaces/sidewalks free from potholes and bumps are desirable. Surfaces must be hard, smooth, level, durable and safe in all weathers.
- Active travel can be encouraged by installing modal filters: roadblocks or planters installed in residential streets that stop rat-running, forcing most motorised traffic onto main roads while giving direct route access and advantages to those on foot or cycling. Reduce motor vehicle traffic volumes and speeds around cyclists, especially when road users mix
- Cycle racks should be installed along cycling routes including at transport interchanges and public buildings.
- Keeping accessibility in mind for the elderly individuals and people with disabilities.
- The concept of the 20-minute neighborhood encompasses the idea that everything you need for a day-to-day living should be within a 20-minute walk.
- Electrically-assisted bikes, or e-bikes are useful for people who, for example, need to ride in business clothes without breaking sweat or travel long distances or for older or less fit. E-bike support programmes, which could include loans, subsidies, or other financial incentives need to be formulated and implemented.
- All forms of agencies working for transport and city infrastructure should work cohesively.
- Conducting a series of national urban road audits help in future allocation of road space to cyclists and pedestrians.
- City authorities and governments should carry out awareness programs to educate citizens about safety protocols and road signages. Initiatives to promote cycling and walking as part of local and daily commute such as Raahgiri , Ciclovía, Car-Free Days and other similar programs, are also helpful.
- Ideally, all urban planning schemes should be designed by people who cycle regularly. Also, those who design schemes should travel through the area on a cycle to understand how it feels – and experience some of the failings.
- All schemes must be consistent. Many schemes take too long to get started and too long to deliver once they have been started. All future funding should be conditional on work starting and finishing by specified dates
- Cities must ensure that a percentage of the budget and revenue from toll taxes and traffic fines is dedicated towards developing and improving safe walking and cycling networks that are prioritized over personal motor vehicular use.
- Bicycle-share schemes that allow anyone to hire a bicycle for short trips should be introduced.
- Cycle-to-Work programmes should be encouraged where the employer pays the upfront cost. This is then paid back through the employee’s monthly salary. Often, the government offers tax benefits.
- Repealing policies that subsidize additional motor vehicle use, such as minimum parking requirements, free on-street parking, and fuel subsidies
- Dedicating fuel taxes, driving fees, and other transport-system revenues toward public transport.
- Higher levels of protection through the law for vulnerable road users can be ensured by increasing the maximum sentence for causing death/injury by dangerous or careless driving when under the influence of drink and drugs.
CONCLUSION
The study showed the current trends of the urban population towards public transport. These were mostly commensurate with previous studies and literature. The study finds that affluence and social status played a significant role in the choice of transport. People were reluctant to walk or cycle to work. However, they are aware of the problems plaguing public and active transport and could cogitate about solutions to promote the same. Measures for promoting public transport and for enhancing the cycling and walking experience in cities were recommended and enlisted. These could be achieved by the cohesive effort of individuals, committees, non-government organizat,ions and government bodies.